
In this article we start to explore the Analytics that are available behind the Matterport 3D Virtual tour.
Numbers and data can tell a positive story very quickly and they certainly do so with 3D virtual Walkthrough tours.
Matterport Inc., the leading spatial data company, has passed an incredible milestone of 5 million spaces captured in over 150 countries around the world!!
As a service partner of Matterport we have seen a massive increase in visitors exploring our clients’ spaces also.
In August of 2020 the above figure was 15.9K, so in 15 months there has been phenomenal traffic and “eyes” on our customers’ websites. Our growth and the success for our clients is mirroring the growth seen globally by Matterport.
“Digital engagement has been rapidly increasing with more than 2 billion views of digital twins served from all over the world. The number of Matterport digital twins has more than doubled since May 2020” *
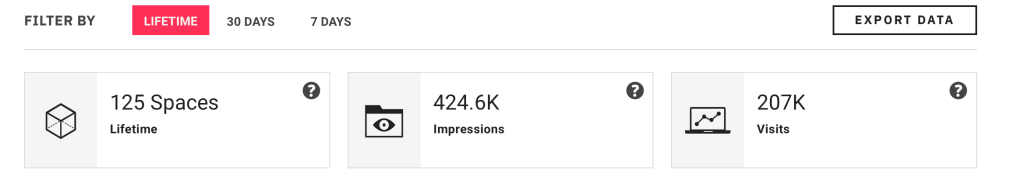
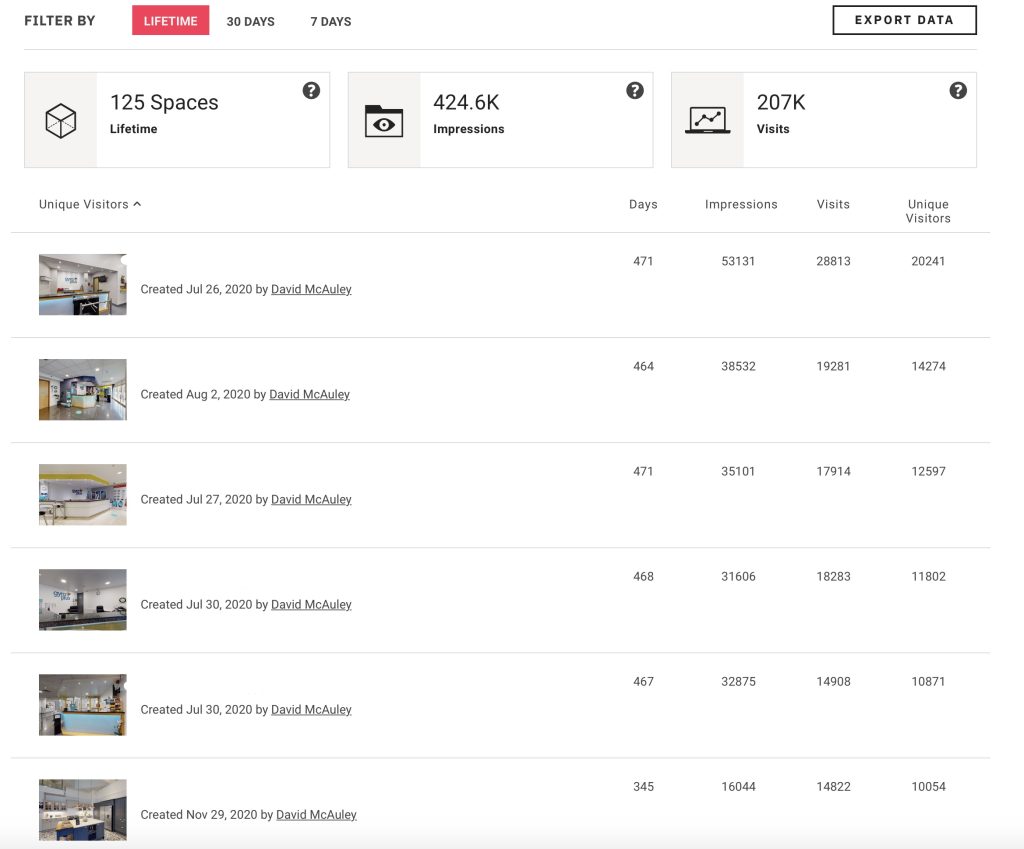
In an “Embedded space” (like a client web site) a visit is counted AFTER the user clicks the play button to load the 3D tour. So, each of these 207,000 are unique visit to our clients’ spaces.
An example of Matterport Space Statistics is shown below. These are updated on a daily basis with adjustable timelines.
In our next article we will explore the additional Analytics that Matterport users can avail of including:
· Average tour time
· Heat maps
· Google Street View
Lookinside.ie is a service partner of Matterport and utilises their Pro 2 Camera, the gold standard for professional 3D capture.
Contact us for a quotation https://www.lookinside.ie/#contact
If you want to know more about the many digital uses of 3D Virtual tours view our previous blog. https://lookinside.proimageblogs.com/digital-flexibility/
*https://matterport.com/news/matterport-accelerates-past-five-million-spaces-under-management.